Observing the CMB
[1]:
import maria
from maria.band import get_band

f090 = get_band("act/pa5/f090")
f150 = get_band("act/pa5/f150")

f090.NET_RJ = 20e-6
f150.NET_RJ = 20e-6

f090.knee = 1e1
f150.knee = 1e1

array = {"field_of_view": 0.3,
         "primary_size": 10,
         "n": 60,
         "packing": "sunflower",
         "shape": "circle",
         "polarized": True,
         "bands": [f090, f150]}

instrument = maria.get_instrument(array=array)

print(instrument)
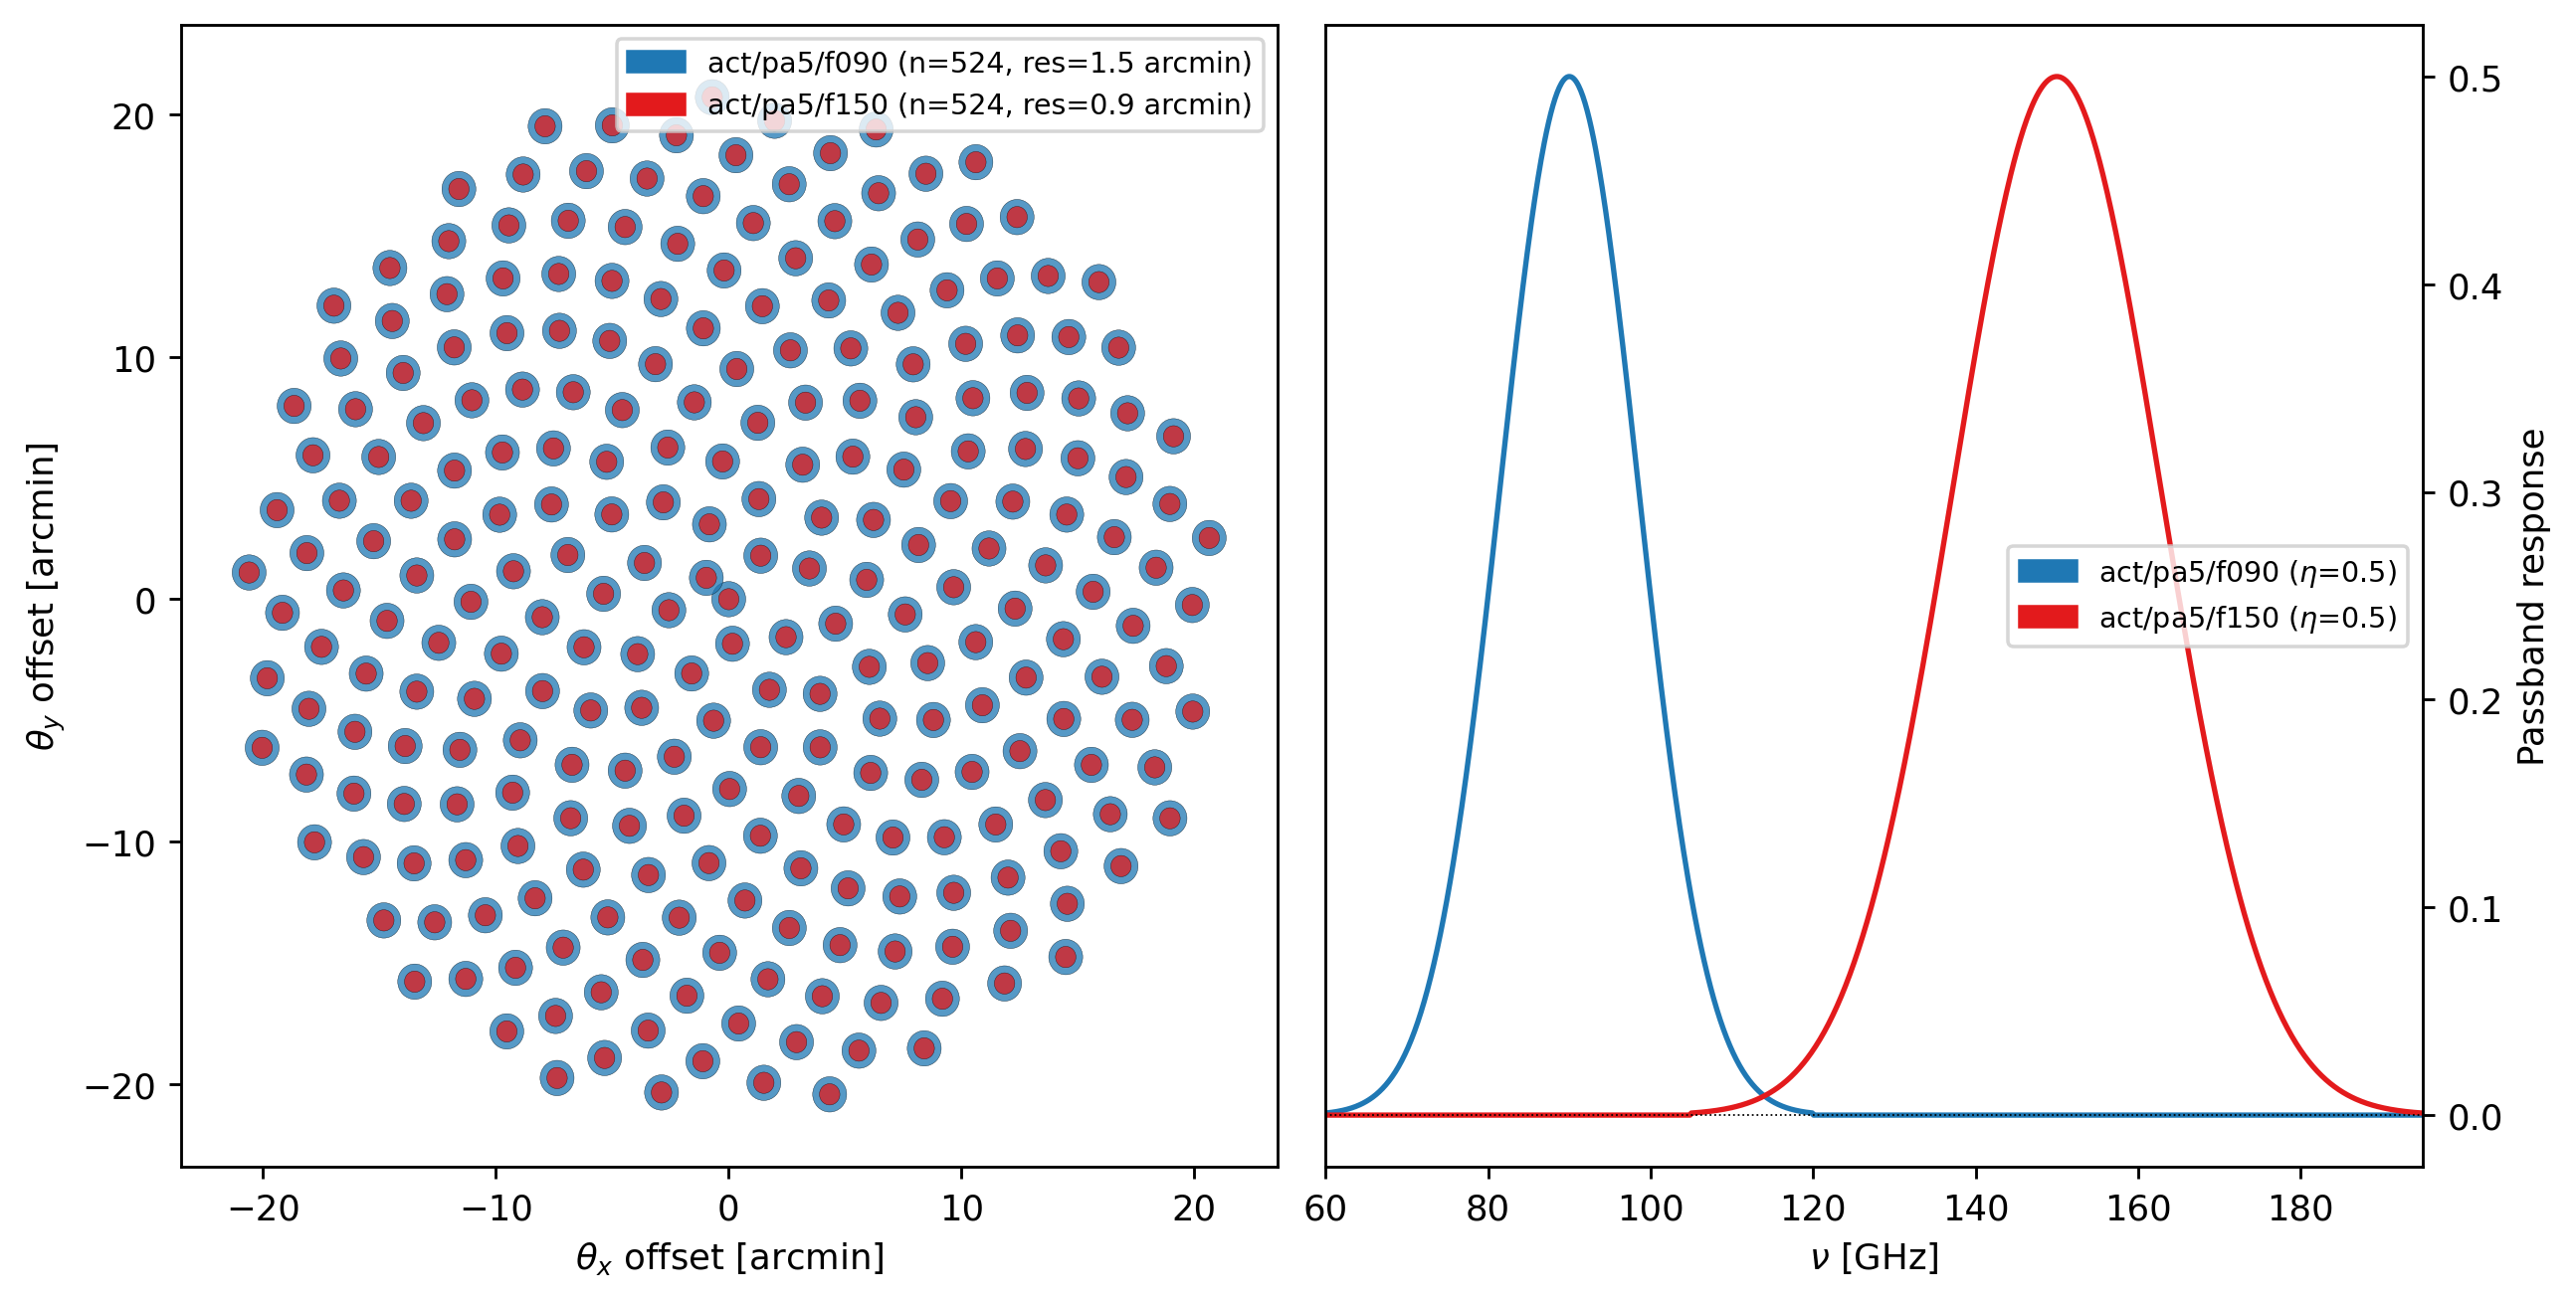
instrument.plot()
Instrument(1 array)
├ arrays:
│            n field_of_view max_baseline                        bands polarized primary_size
│  array1  240           18’          0 m  [act/pa5/f090,act/pa5/f150]      True         10 m
│
└ bands:
              name   center   width    η         NEP      NET_RJ         NET_CMB    FWHM
   0  act/pa5/f090   90 GHz  20 GHz  0.5  2.938 aW√s  20 uK_RJ√s  24.58 uK_CMB√s  1.458’
   1  act/pa5/f150  150 GHz  30 GHz  0.5  4.407 aW√s  20 uK_RJ√s  34.67 uK_CMB√s  52.49”
[2]:
from maria import Plan

plan1 = Plan.generate(duration=600,
                     sample_rate=25,
                     start_time="2026-08-05T06:00:00",
                     scan_type="back-and-forth",
                     scan_parameters={"az_center": 90,
                                      "el_center": 45,
                                      "az_throw": 2,
                                     },
                     site="cerro_toco")

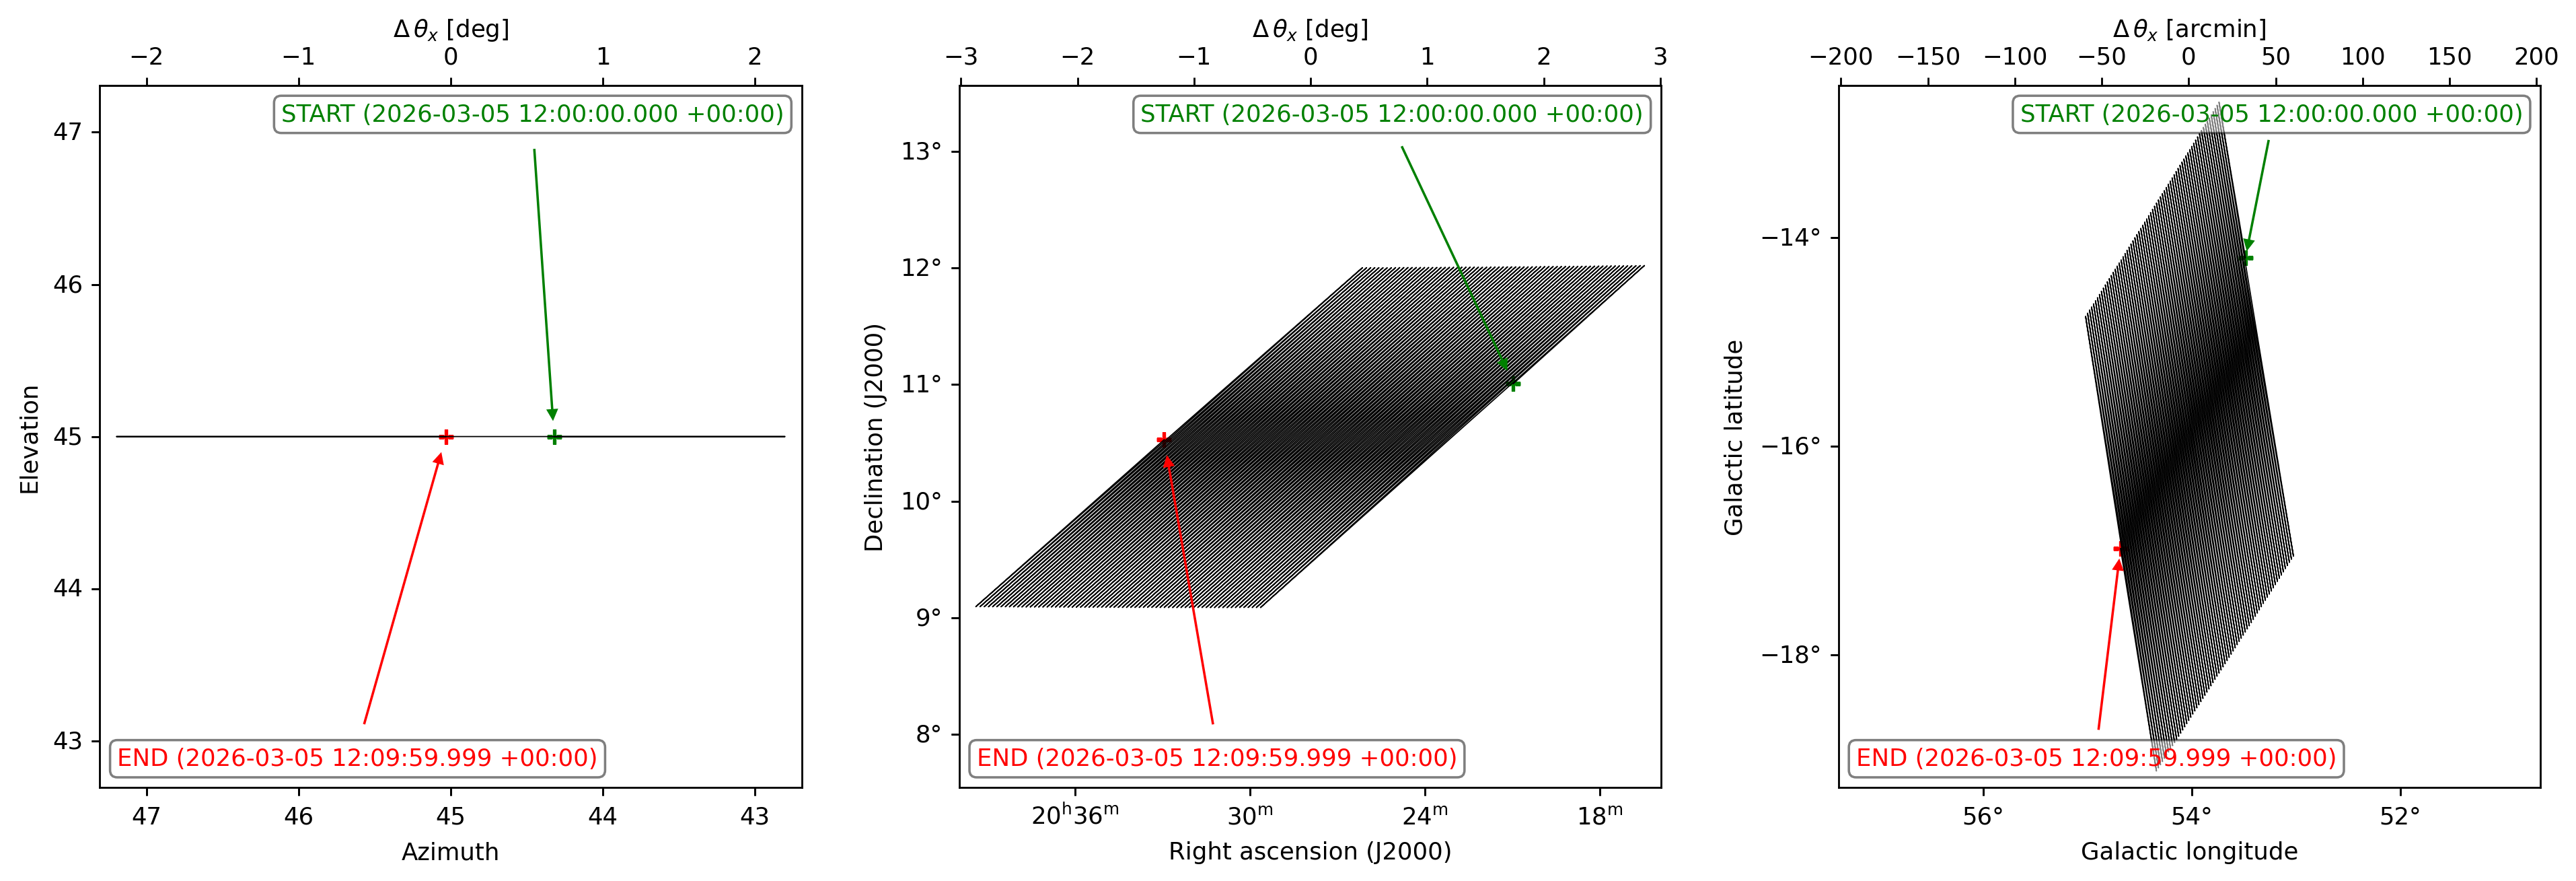
plan1.plot(frames=["az/el", "ra/dec", "glon/glat"])

plan2 = Plan.generate(duration=600,
                     sample_rate=25,
                     start_time="2026-08-05T12:18:00",
                     scan_type="back-and-forth",
                     scan_parameters={"az_center": -90,
                                      "el_center": 45,
                                      "az_throw": 2,
                                     },
                     site="cerro_toco")

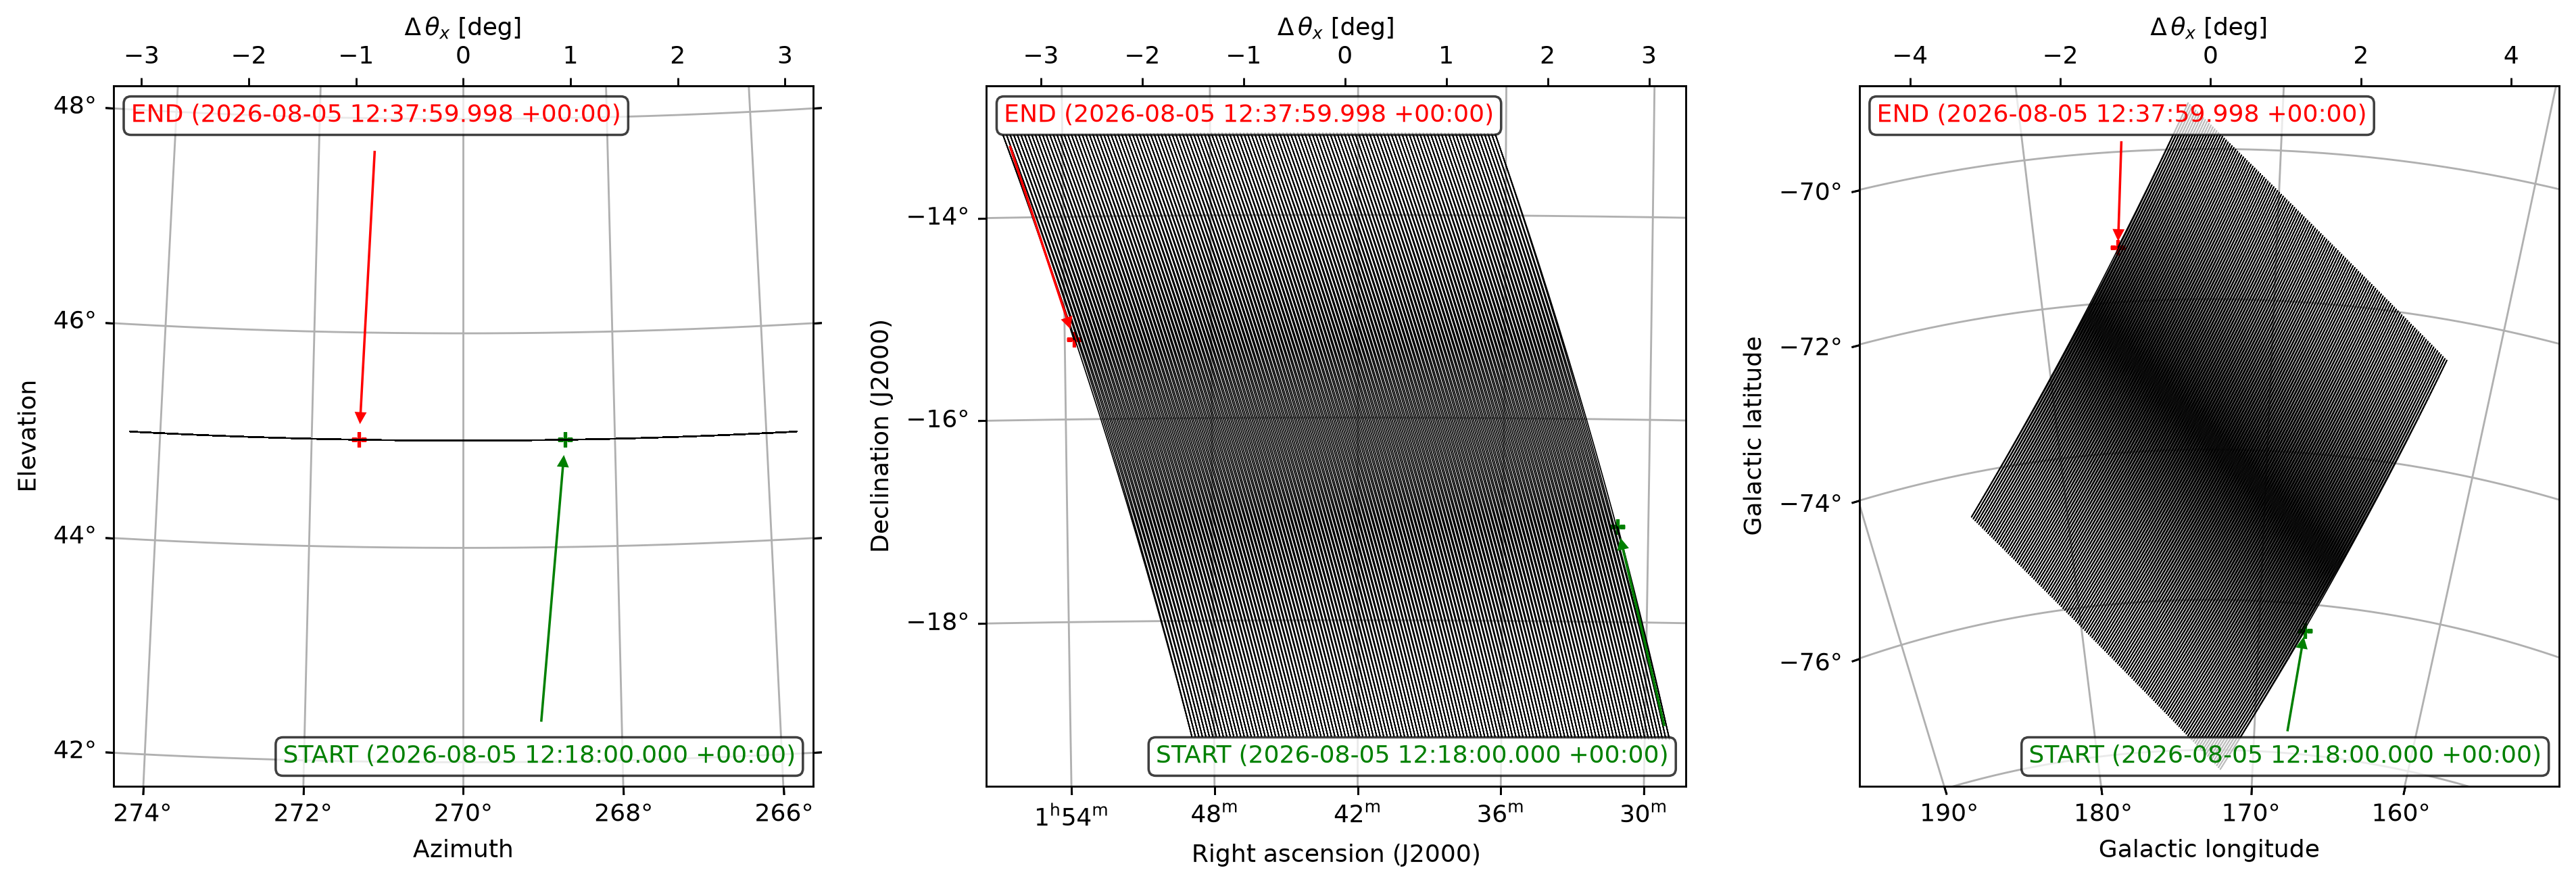
plan2.plot(frames=["az/el", "ra/dec", "glon/glat"])
[3]:
sim = maria.Simulation(
    instrument=instrument,
    plans=[plan1, plan2],
    site="cerro_toco",
    cmb="generate",
    cmb_kwargs={"nside": 1024},
)

print(sim)
2026-10-22 15:35:14.680 INFO: Initializing observation 1/2
2026-10-22 15:35:15.192 INFO: Initialized observation 1/2 in 504.6 ms
2026-10-22 15:35:15.193 INFO: Initializing observation 2/2
2026-10-22 15:35:15.280 INFO: Initialized observation 2/2 in 80.31 ms
Generating CMB (nside=1024):   0%|          | 0/1 [00:00<?, ?it/s]2026-10-22 15:35:16.218 INFO: Fetching https://github.com/thomaswmorris/maria-data/raw/master/cmb/spectra/lensed.csv

Downloading: |          | 3.72M/? [00:00<00:00, 128MB/s]
Generating CMB (nside=1024): 100%|██████████| 1/1 [00:10<00:00, 10.18s/it]
Simulation
├ Instrument(1 array)
│ ├ arrays:
│ │            n field_of_view max_baseline                        bands polarized primary_size
│ │  array1  240           18’          0 m  [act/pa5/f090,act/pa5/f150]      True         10 m
│ │
│ └ bands:
│               name   center   width    η         NEP      NET_RJ         NET_CMB    FWHM
│    0  act/pa5/f090   90 GHz  20 GHz  0.5  2.938 aW√s  20 uK_RJ√s  24.58 uK_CMB√s  1.458’
│    1  act/pa5/f150  150 GHz  30 GHz  0.5  4.407 aW√s  20 uK_RJ√s  34.67 uK_CMB√s  52.49”
├ Site:
│   region: chajnantor
│   timezone: America/Santiago
│   location:
│     longitude: 67°47’16.08” W
│     latitude:  22°57’30.96” S
│     altitude: 5.19 km
│   seasonal: True
│   diurnal: True
├ PlanList(2 plans, 1200 s):
│                            start_time duration sample_rate   target(az,el)
│ chunk
│ 0      2026-08-05 06:00:00.000 +00:00    600 s       25 Hz   (90°, 45.01°)
│ 1      2026-08-05 12:18:00.000 +00:00    600 s       25 Hz  (270°, 45.01°)

└ HEALPixMap:
    data(3, 1, 12582912):
      min: -5.602e-04
      max: 5.685e-04
      units: K_CMB
      quantity: cmb_temperature_anisotropy
    stokes(3):
      components: ['I' 'Q' 'U']
    z(1):
      values: [1089.92]
    pixels(12582912):
      nside: 1024
      resolution: 3.435’
    frame: ra/dec
    beam(maj, min, rot): (0 rad, 0 rad, 0 rad)
    memory: 302 MB
[4]:
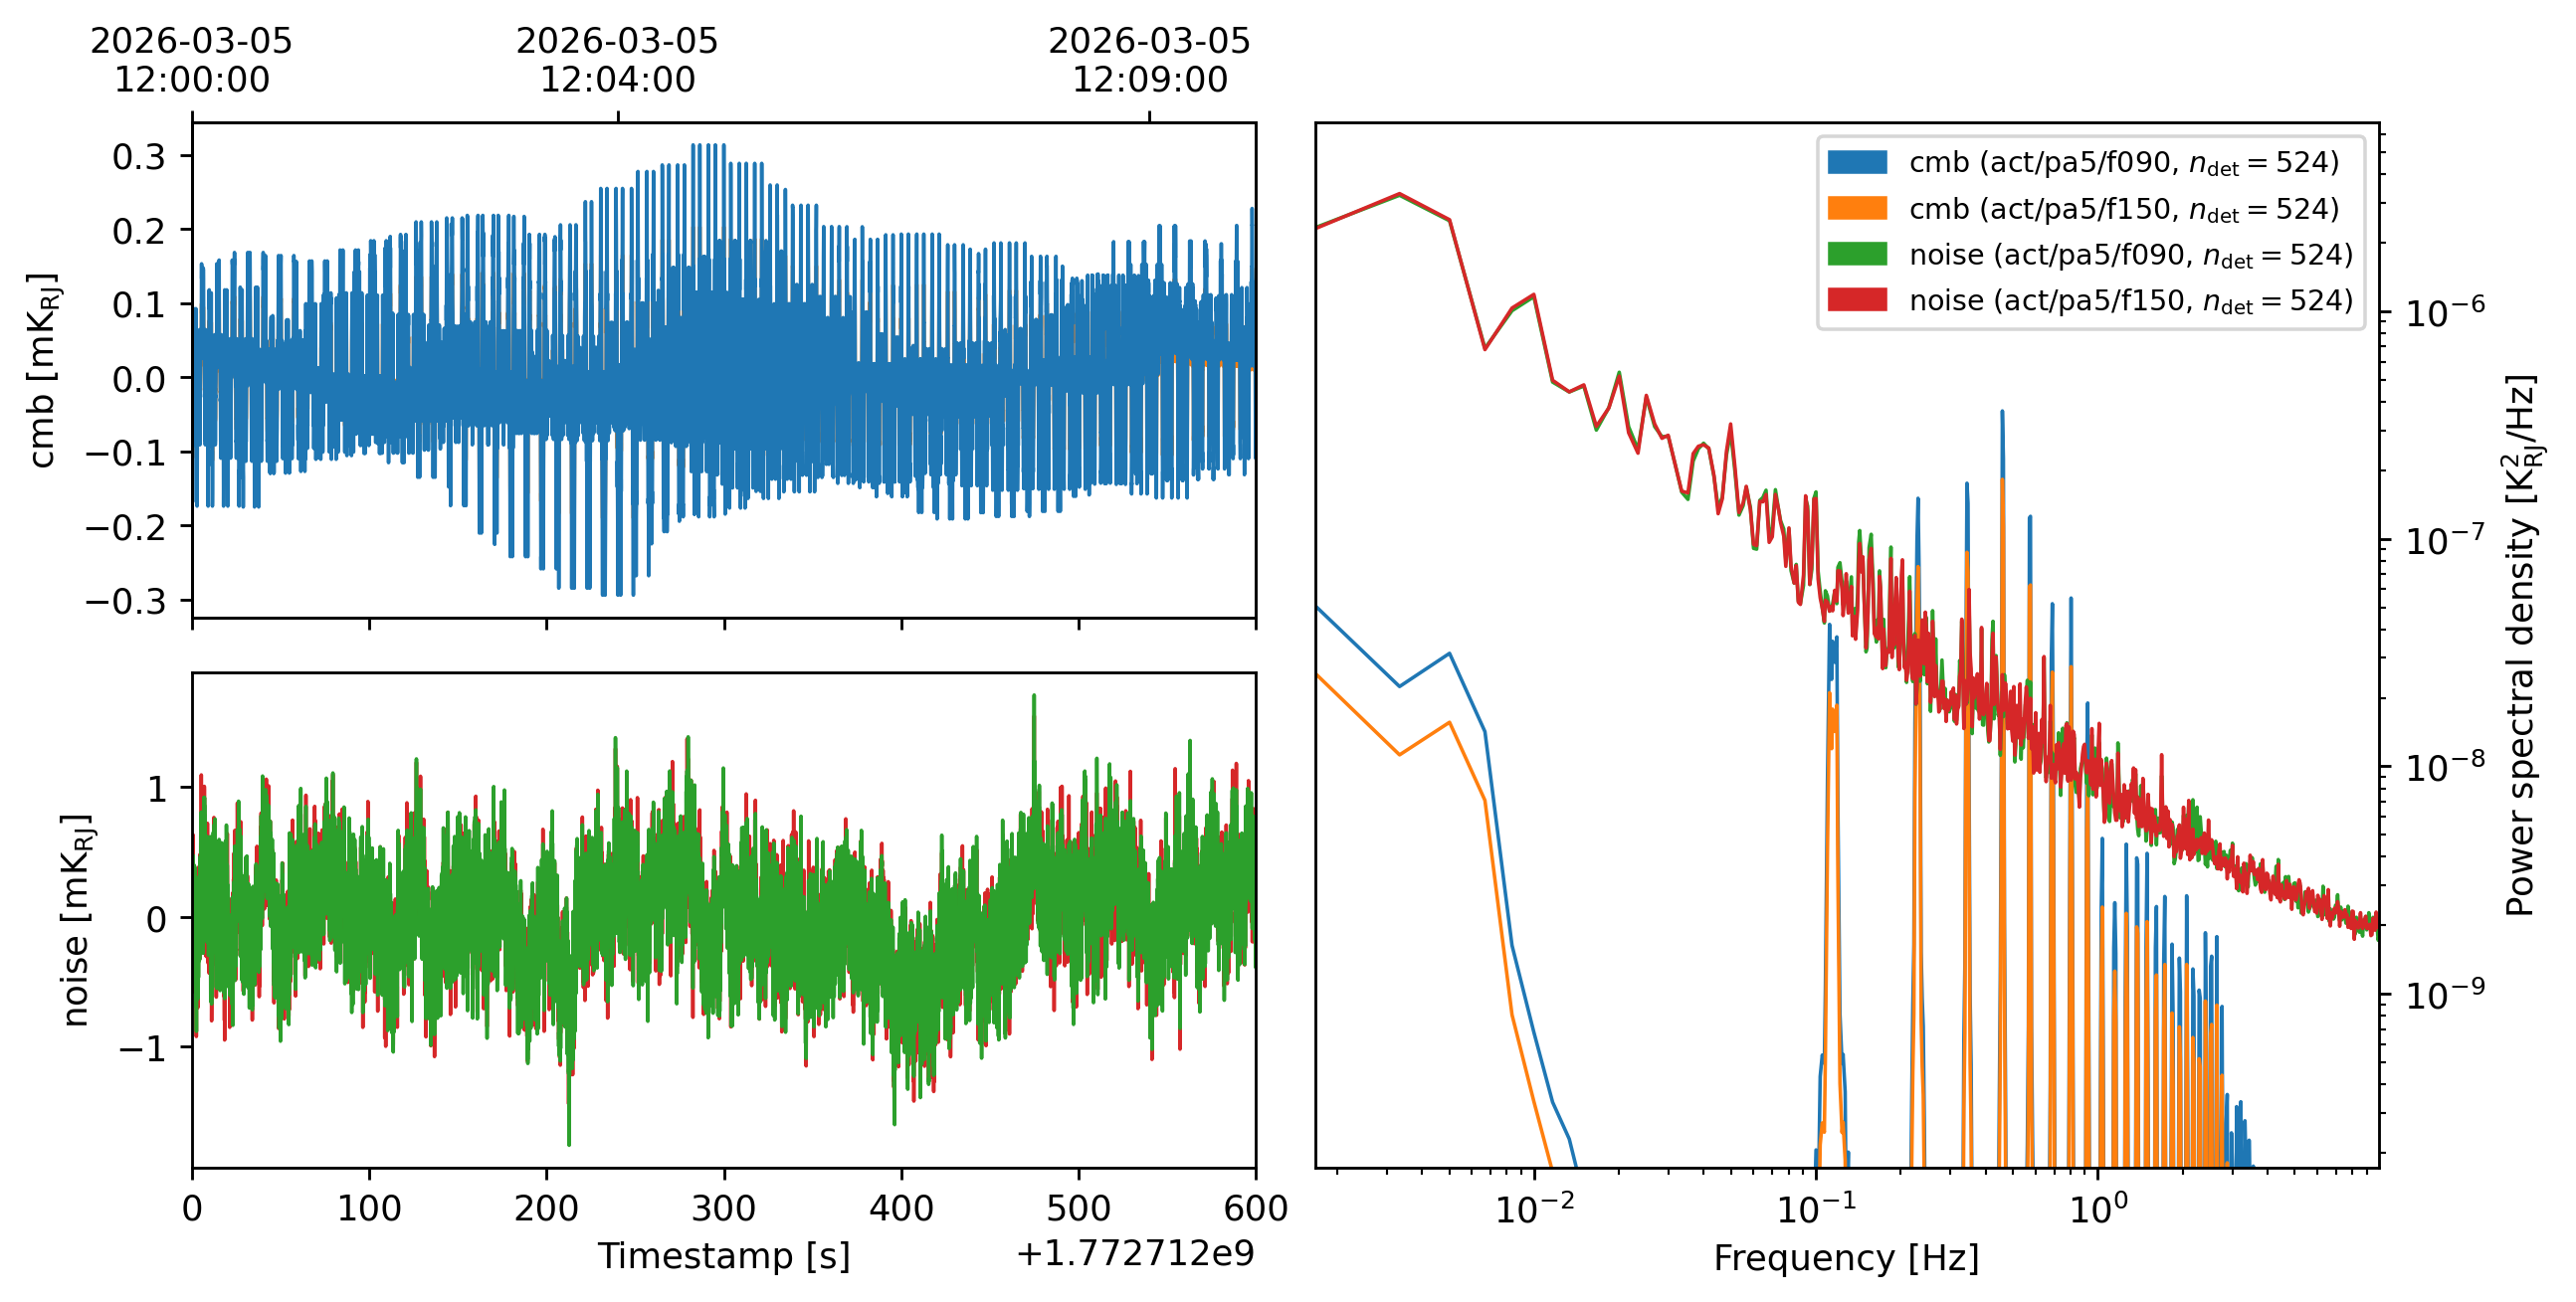
tods = sim.run()
tods[0].plot()
2026-10-22 15:35:26.075 INFO: Simulating observation 1 of 2
Sampling source 'cmb': 100%|██████████| 2/2 [00:09<00:00,  4.83s/it, band=act/pa5/f150, message=Sampling channel (105 GHz, 195 GHz)]
Generating noise: 100%|██████████| 2/2 [00:00<00:00,  3.06it/s, band=act/pa5/f150]
2026-10-22 15:35:36.610 INFO: Simulated observation 1 of 2 in 10.53 s
2026-10-22 15:35:36.611 INFO: Simulating observation 2 of 2
Sampling source 'cmb': 100%|██████████| 2/2 [00:08<00:00,  4.42s/it, band=act/pa5/f150, message=Sampling channel (105 GHz, 195 GHz)]
Generating noise: 100%|██████████| 2/2 [00:00<00:00,  3.77it/s, band=act/pa5/f150]
2026-10-22 15:35:46.175 INFO: Simulated observation 2 of 2 in 9.557 s
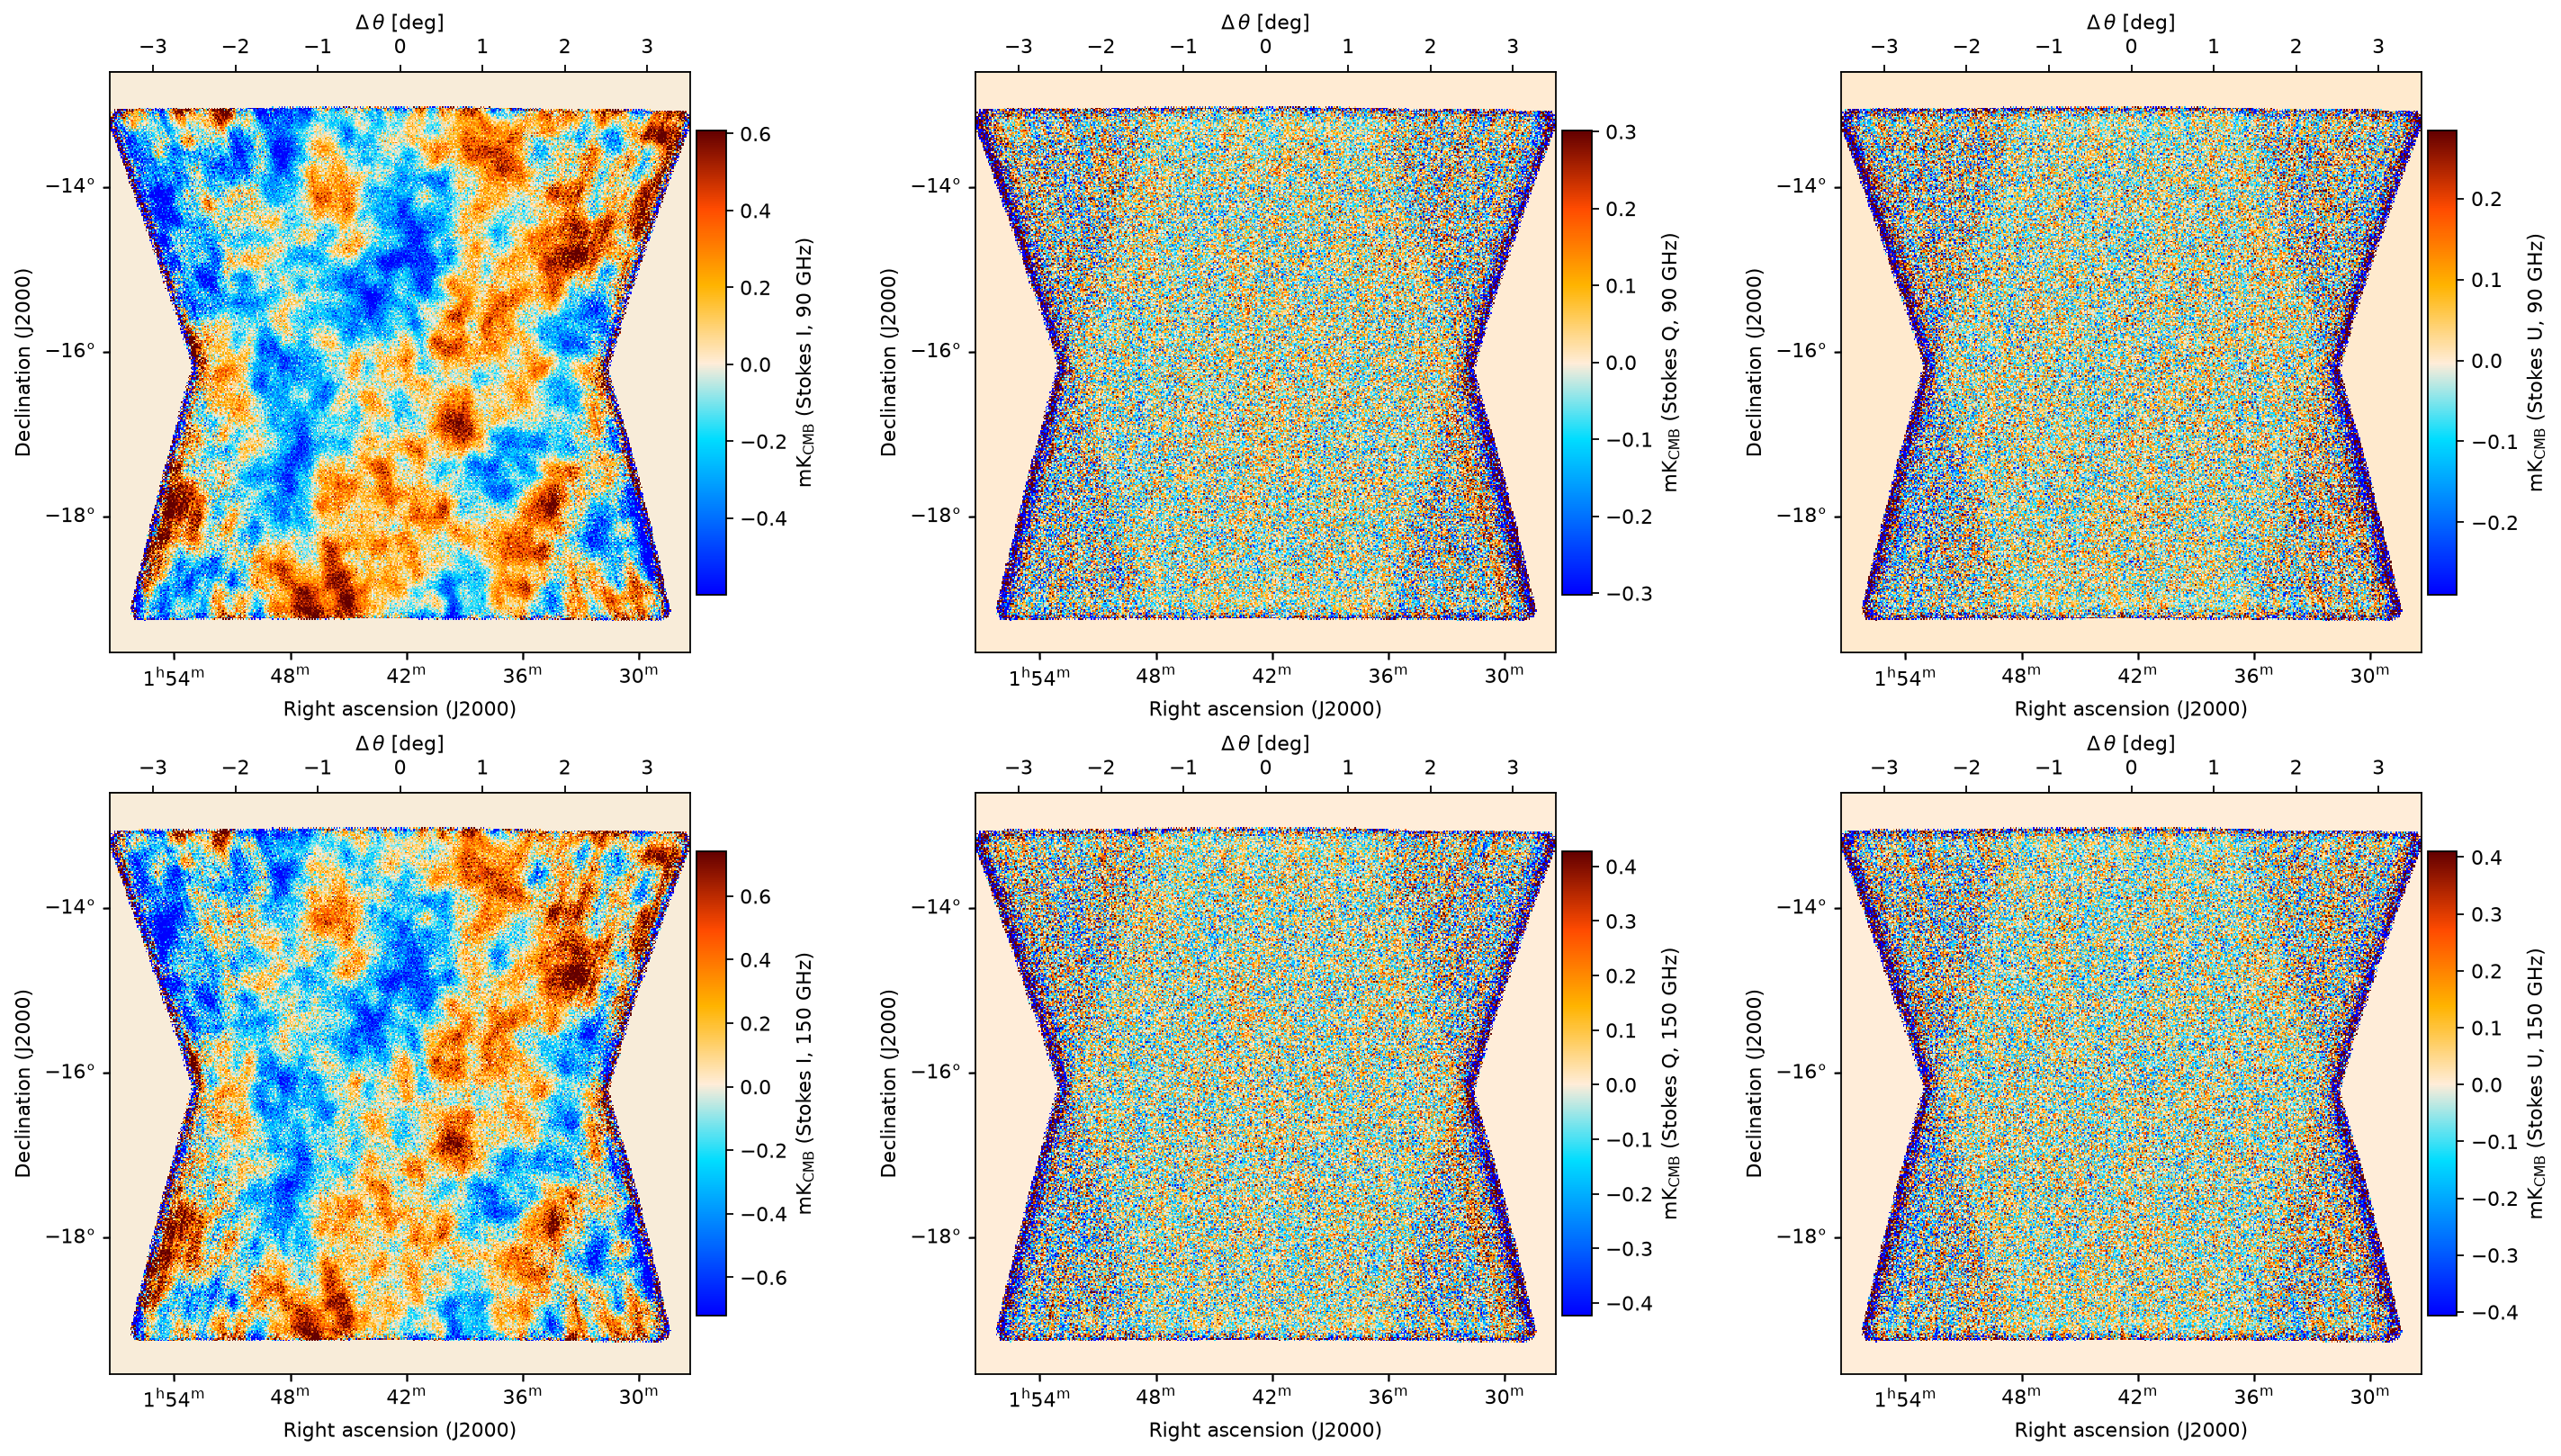
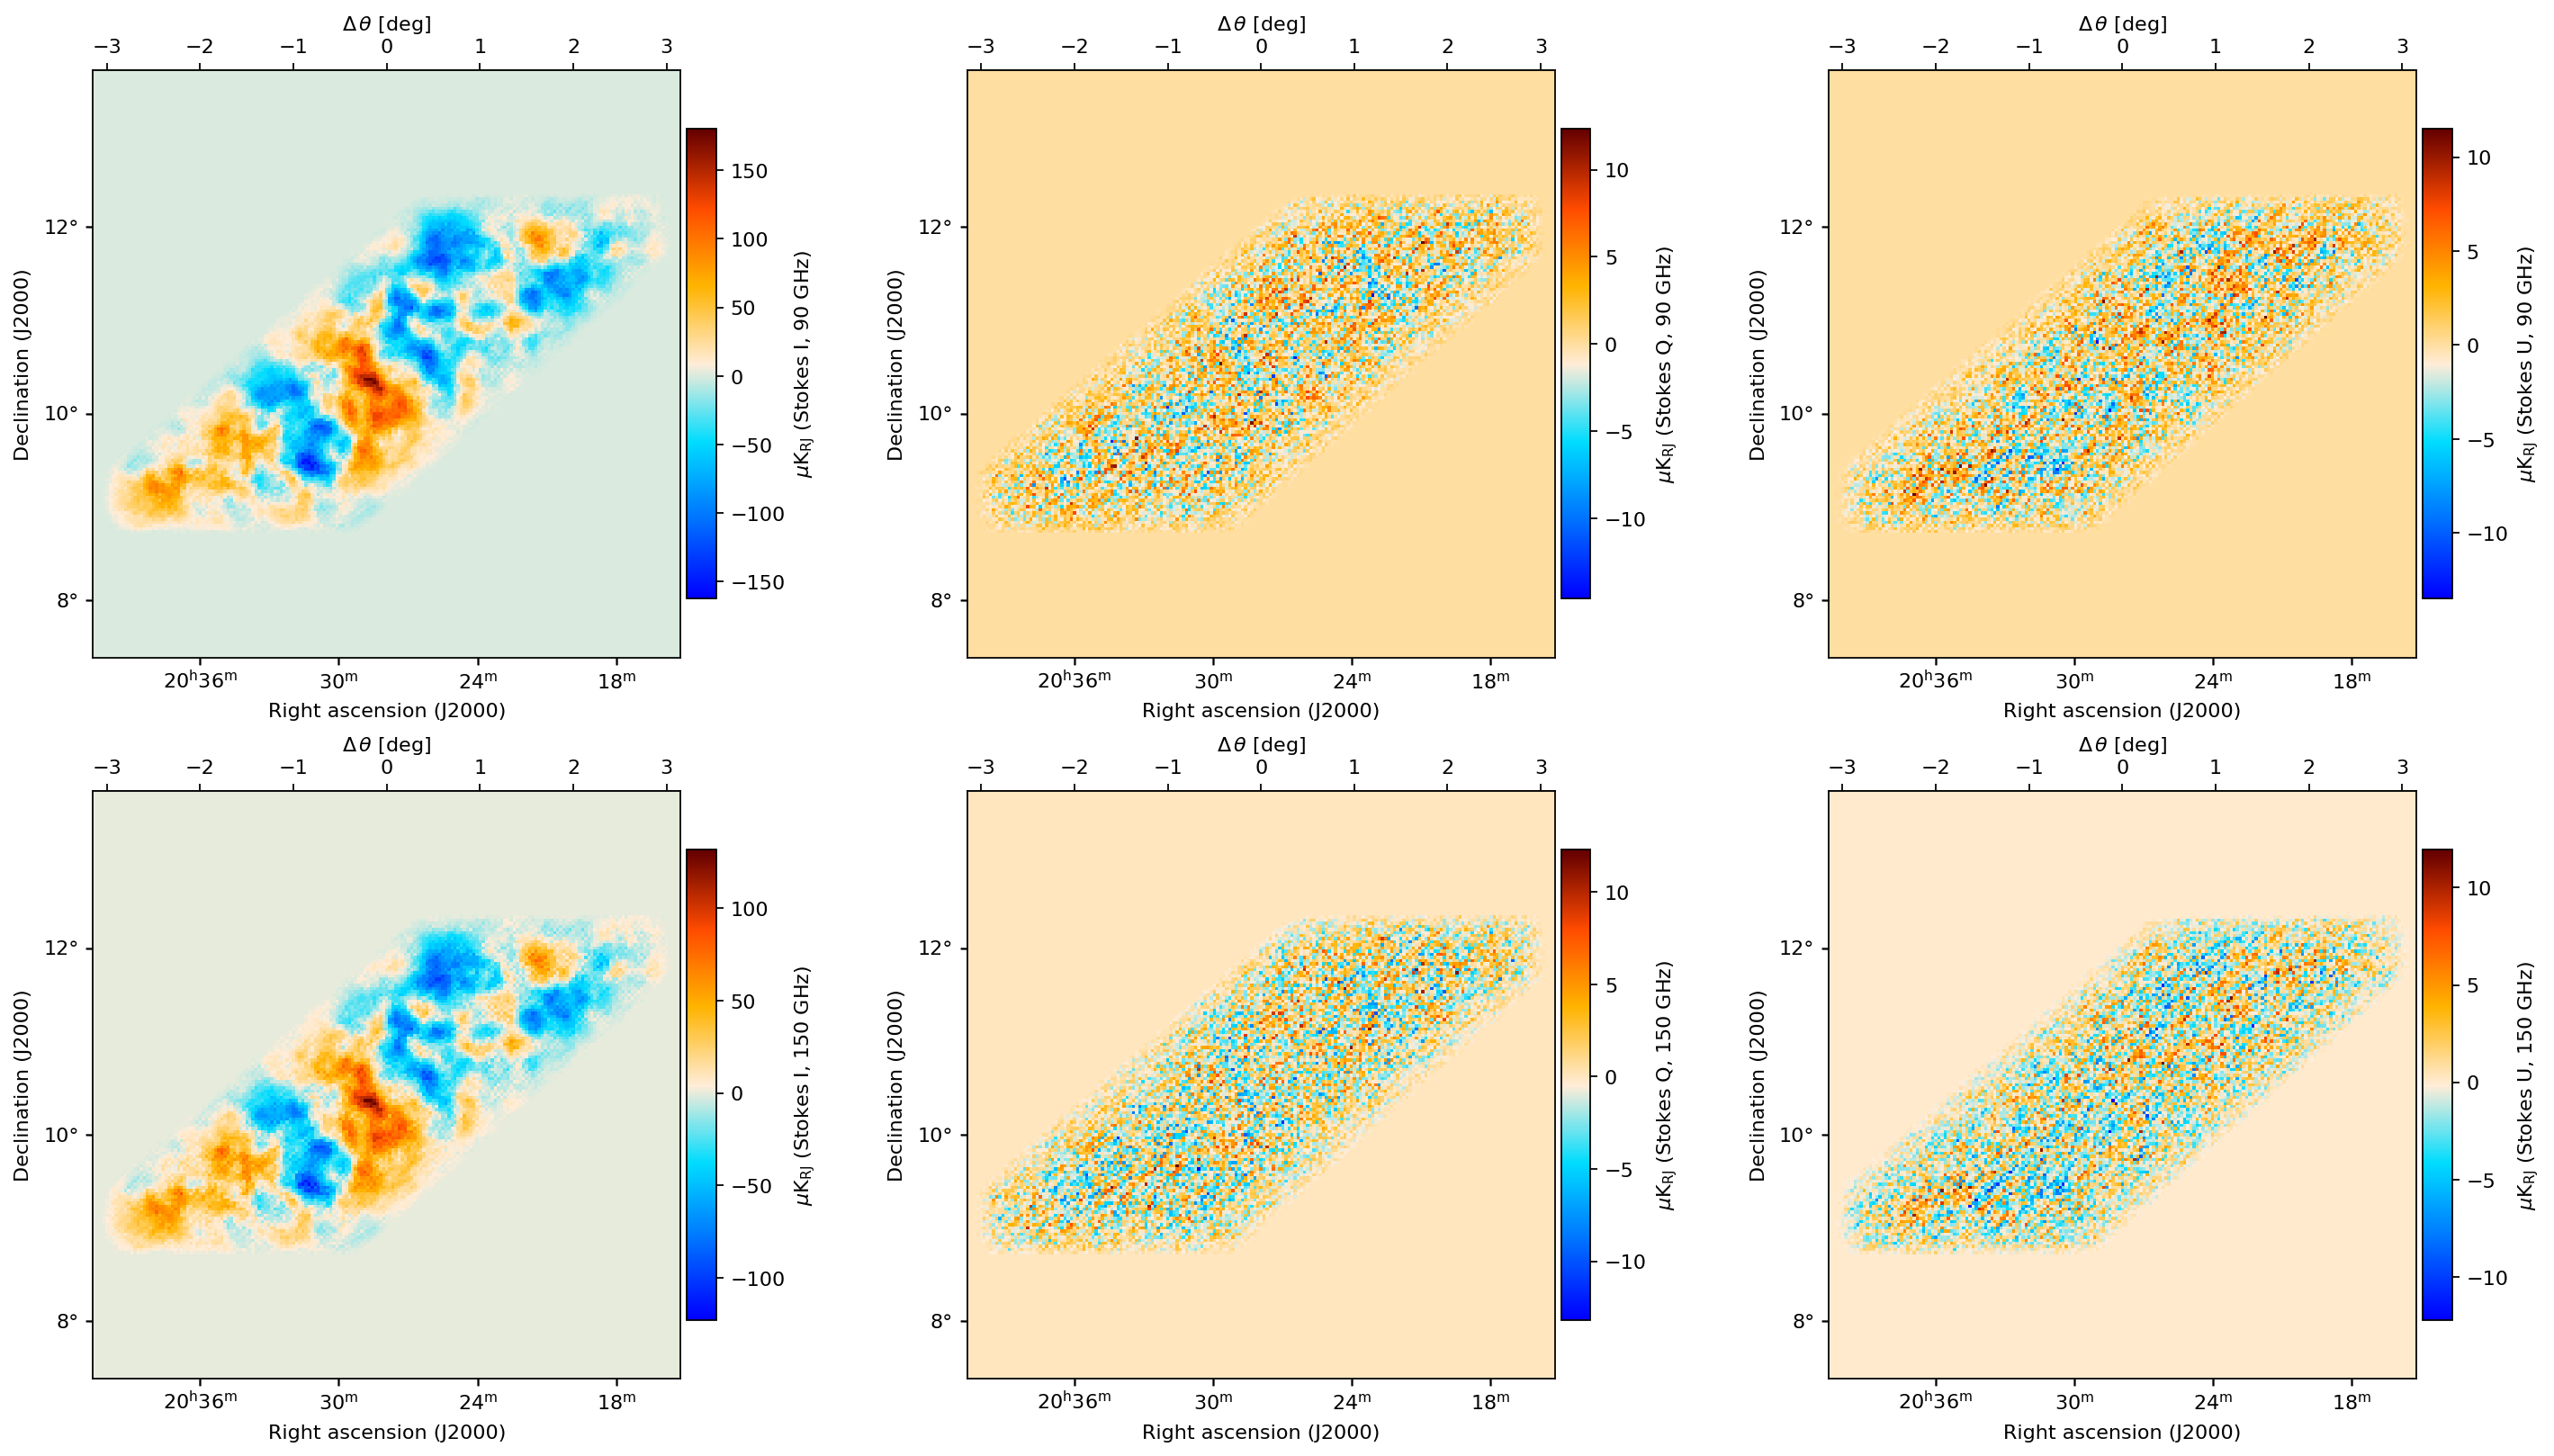
Binning the data gives us a
[5]:
from maria.mappers import *

plot_kwargs = {"slices": dict(stokes=["I", "Q", "U"], nu=[[0], [1]]), "contrast": 1e-2}

bin_mapper = BinMapper(tods=tods,
                       units="uK_CMB",
                       resolution=2 / 60,
                       frame="ra/dec",
                       tod_preprocessing={
                        "remove_polynomial": {"time": 3},
                       },
                      )

bin_mapper.run()
bin_mapper.map.plot(**plot_kwargs)
2026-10-22 15:35:51.345 INFO: Inferring center {'ra': '01ʰ37ᵐ19.10ˢ', 'dec': '-16°09’0.44”'} for mapper
2026-10-22 15:35:51.354 INFO: Inferring mapper width 3.61° for mapper from observation patch
2026-10-22 15:35:51.354 INFO: Inferring mapper height 3.61° to match supplied width
2026-10-22 15:35:51.651 INFO: Inferring stokes parameters 'IQU' for mapper from detector sensitivities
Preprocessing TODs: 100%|██████████| 2/2 [00:00<00:00,  5.12it/s]
Mapping: 100%|██████████| 2/2 [00:01<00:00,  1.80it/s, tod=1/2]
[6]:
from maria.mapping.ml_mapper import *

ml_mapper = MaximumLikelihoodMapper(tods=tods,
                                    units="uK_CMB",
                                    resolution=1 / 60,
                                    frame="ra/dec",
                                    tod_preprocessing={
                                    "remove_polynomial": {"time": 3},
                                   },
                                   )
2026-10-22 15:35:56.524 INFO: Inferring center {'ra': '01ʰ37ᵐ19.10ˢ', 'dec': '-16°09’0.44”'} for mapper
2026-10-22 15:35:56.533 INFO: Inferring mapper width 3.592° for mapper from observation patch
2026-10-22 15:35:56.533 INFO: Inferring mapper height 3.592° to match supplied width
2026-10-22 15:35:56.805 INFO: Inferring stokes parameters 'IQU' for mapper from detector sensitivities
Preprocessing TODs: 100%|██████████| 2/2 [00:00<00:00,  6.52it/s]
Computing pointing matrices: 100%|██████████| 2/2 [00:04<00:00,  2.22s/it]
[7]:
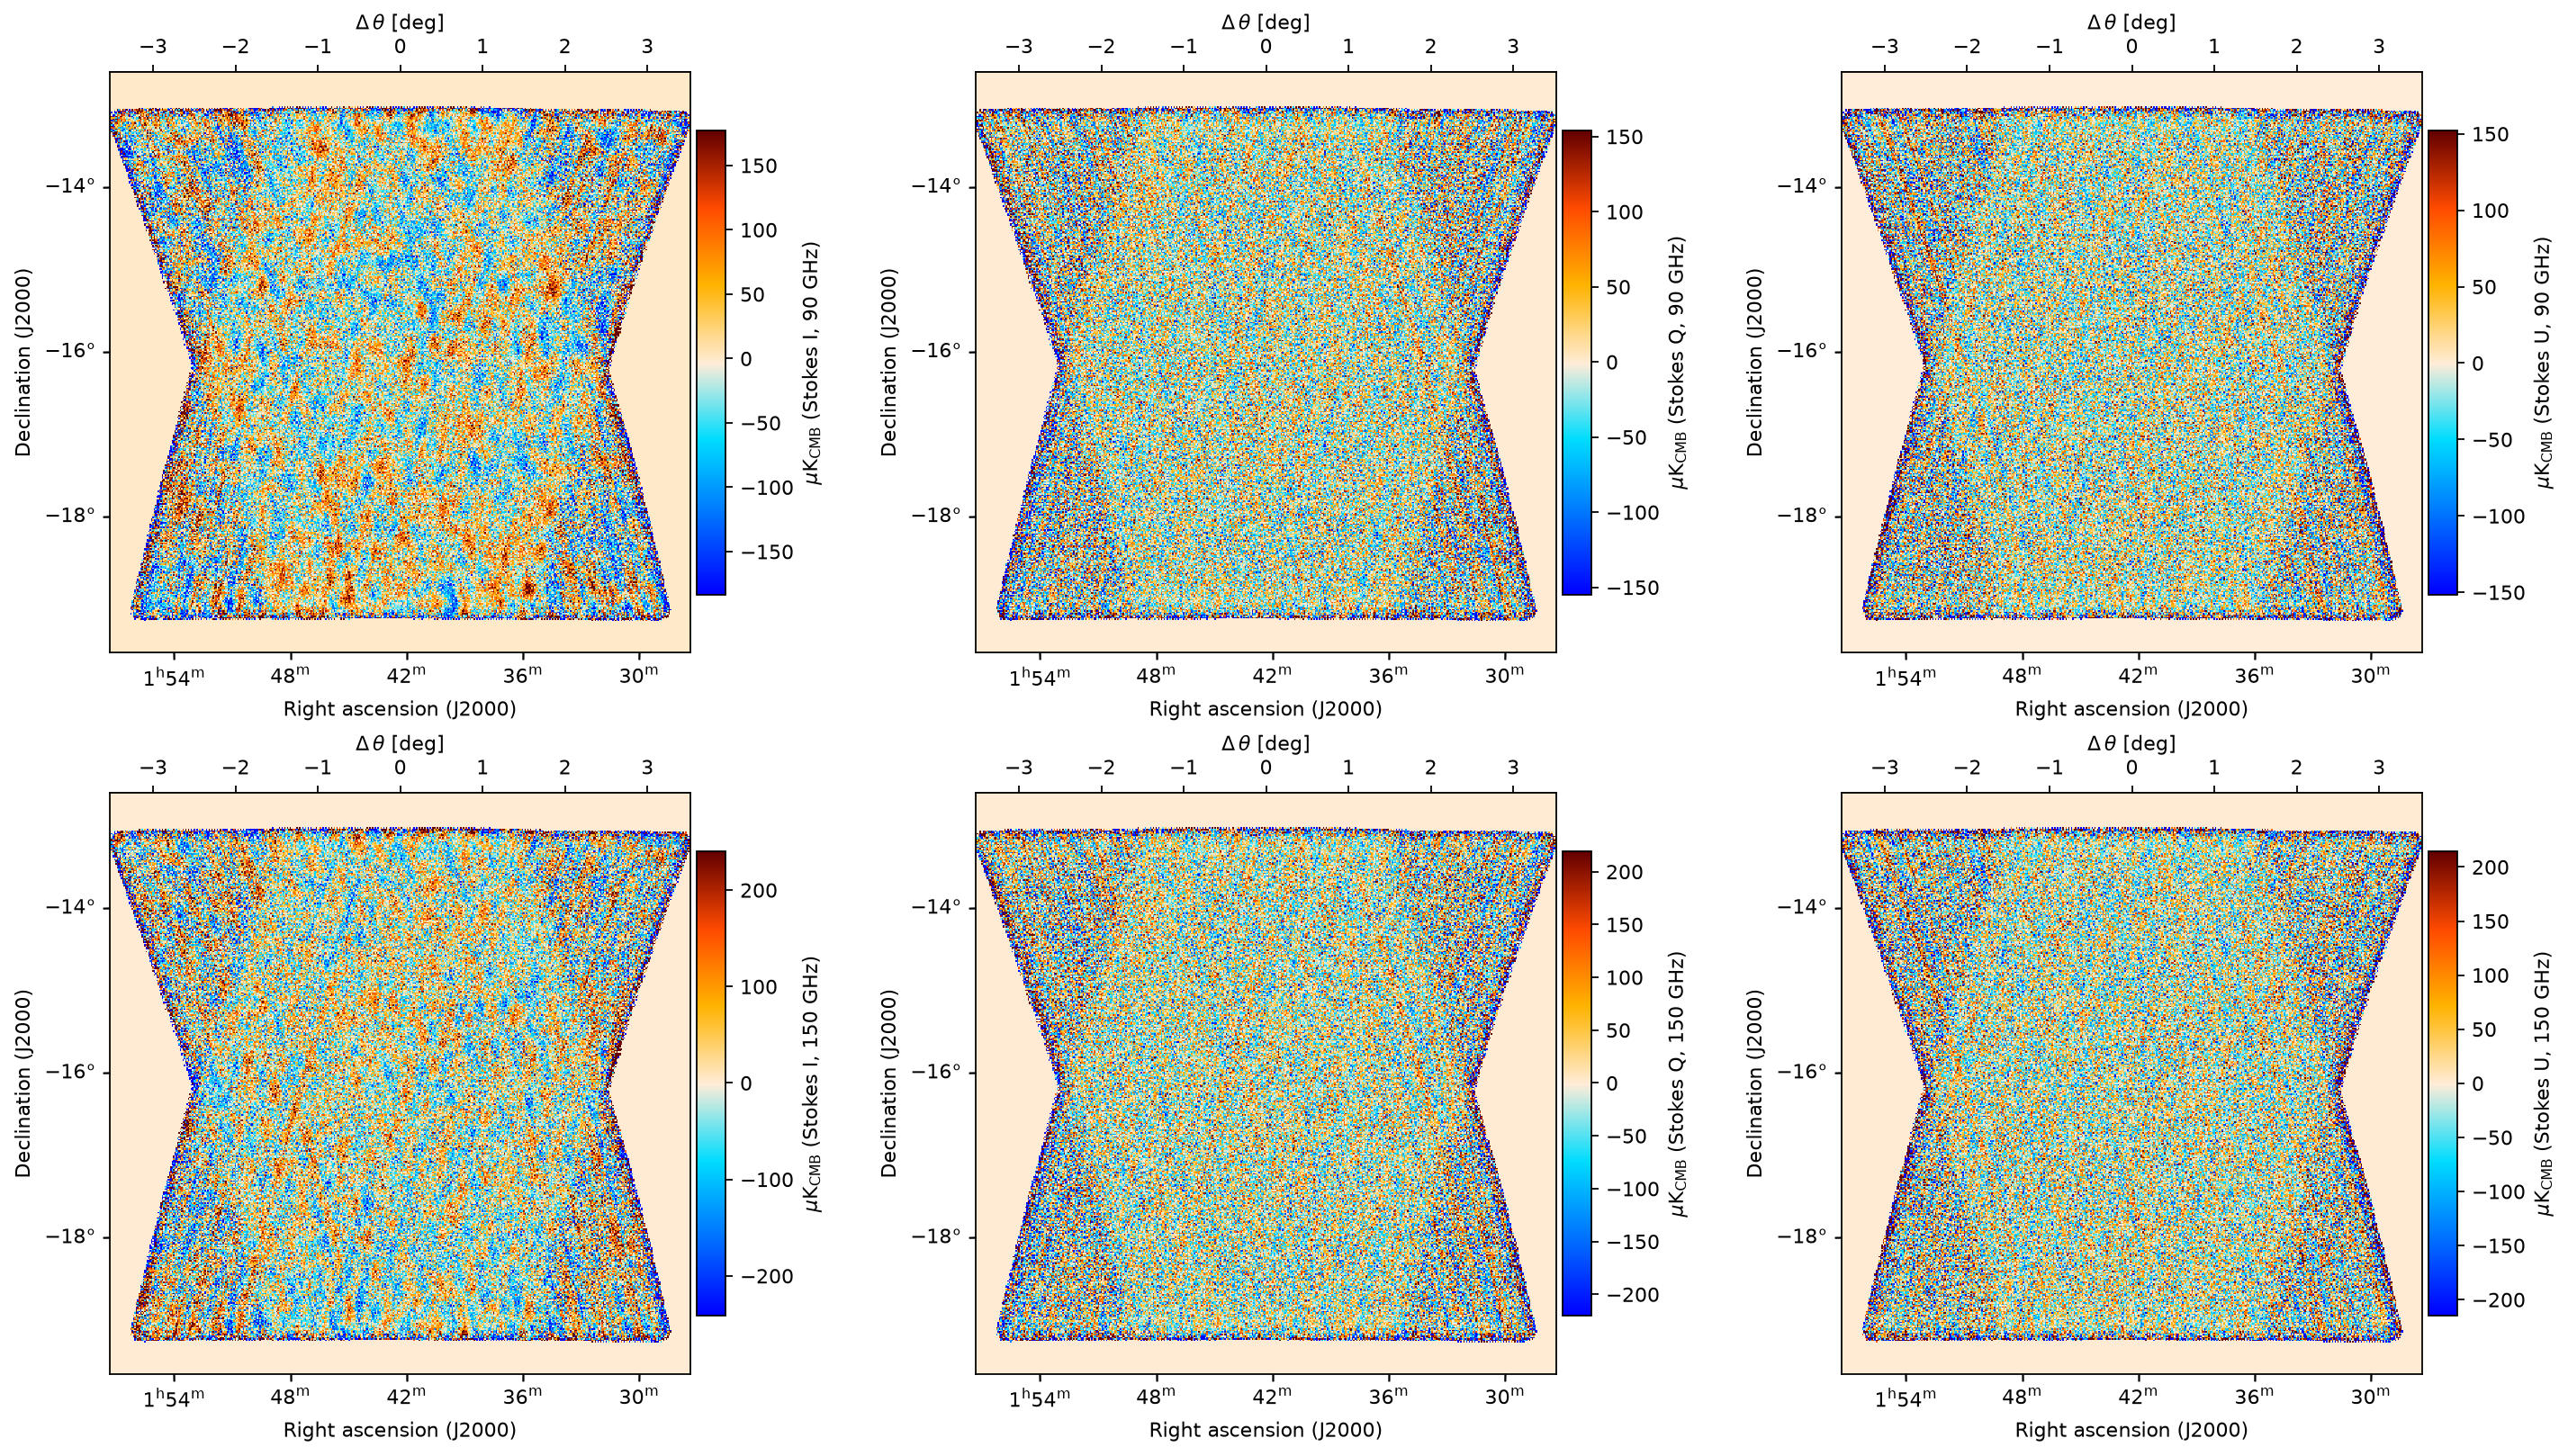
print(ml_mapper.map)
ml_mapper.map.plot(**plot_kwargs)
ProjectionMap:
  data(3, 2, 215, 215):
    min: -1.533e+03
    max: 1.688e+03
    units: uK_CMB
    quantity: cmb_temperature_anisotropy
  stokes(3):
    components: ['I' 'Q' 'U']
  nu(2):
    values: [ 90. 150.] GHz
  eta(215):
    height: 3.567°
    res: -60”
  xi(215):
    width: 3.567°
    res: 60”
  frame: ra/dec
  center:
    ra: 01ʰ37ᵐ19.10ˢ
    dec: -16°09’0.44”
  beam(maj, min, psi): ragged
  memory: 2.219 MB
[8]:
ml_mapper.fit(epochs=1,
              max_steps_per_epoch=50,
              plot=True,
              plot_kwargs=plot_kwargs)
Updating noise model: 100%|██████████| 2/2 [00:05<00:00,  2.65s/it, tod=2/2]
Fitting map (epoch 1/1): 100%|██████████| 50/50 [02:35<00:00,  3.12s/it, alpha=1.83e+8]