Bands
The Band defines all aspects of how detectors on an array will respond to incident radiation, including
How the detectors respond to different frequencies of radiation.
The efficiencies of the detectors.
The noise properties of the detectors.
The variation in detector gains across the array.
We can create the simplest possible Band as e.g.
import matplotlib.pyplot as plt
from maria import Band

my_band = Band(center=150e9, # in Hz
               width=30e9) # in Hz

my_band.plot()
(Source code, png, hires.png, pdf)
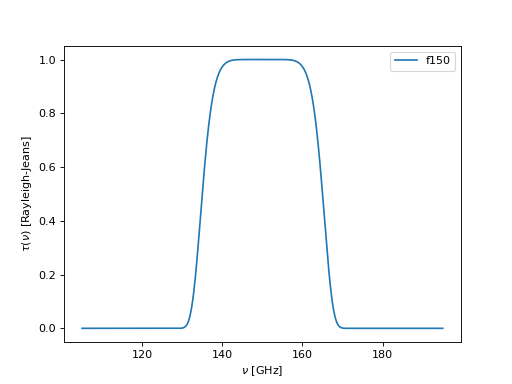
The center and width parameters define the shape of the passband $\tau(\nu)$. The convention of $\tau(\nu)$ is that of a Rayleigh-Jeans source, so that the power incident on each detector in the band will be
\[P = \eta k \int_0^\infty T_b(\nu) \tau(\nu) d\nu\]
where $\eta$ is the efficiency (from the supplied efficiency parameter) and $k$ is Boltzmann’s constant.